
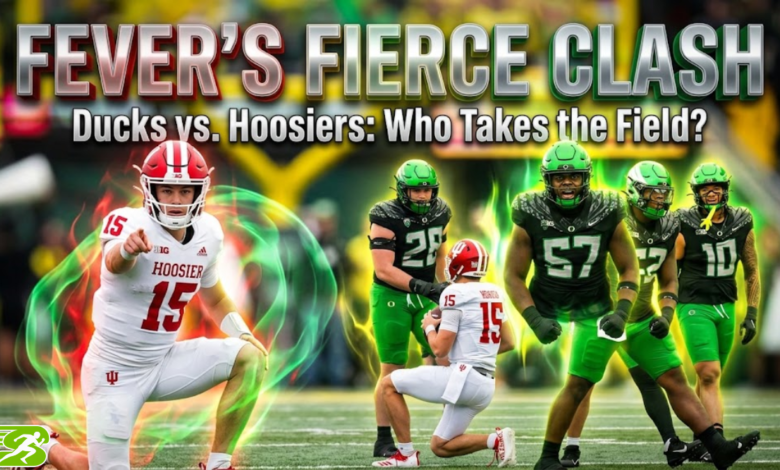
The Oregon Ducks football vs Indiana Hoosiers football match player stats provide a way to compare quarterback performance, rushing production, receiving yards, and defensive impact. To identify the players who made the biggest difference, start with the official box score and match each player’s numbers to the game’s result. The exact statistics depend on which meeting you’re reviewing.
Which game are these player statistics from?
This breakdown covers the January 9, 2026, College Football Playoff semifinal between Oregon and Indiana at Mercedes-Benz Stadium in Atlanta, Georgia. Indiana won 56-22, advancing after a dominant offensive performance and several major defensive plays.
That date matters because the teams also met during the 2025 regular season. Their October 11 meeting ended with Indiana winning 30-20 in Eugene, Oregon. The two games produced different statistical patterns, so mixing their box scores would give readers an inaccurate picture.
Oregon Ducks vs Indiana Hoosiers individual player stats
The January playoff game featured strong passing production from Oregon, efficient scoring from Indiana, and a major difference in rushing yards. The table below highlights the leading individual performers from the official box score.
| Statistical category | Oregon Ducks | Indiana Hoosiers |
| Passing leader | Dante Moore, 285 yards | Fernando Mendoza, 177 yards |
| Rushing leader | Dierre Hill Jr., 86 yards | Kaelon Black, 63 yards |
| Receiving leader | Jamari Johnson, 83 yards | Elijah Sarratt, 75 yards |
| Team passing yards | 285 | 177 |
| Team rushing yards | 93 | 185 |
| Final score | 22 | 56 |
These Oregon Ducks football vs Indiana Hoosiers football match player stats reveal an important distinction: Oregon gained more yards through the air, but Indiana produced nearly twice as many rushing yards. The final score also shows why passing totals alone don’t explain the outcome.
Quarterback stats: Dante Moore vs Fernando Mendoza
Quarterbacks direct the offense and throw passes to receivers. Their completion totals, passing yards, touchdowns, and interceptions help explain how effectively each team moved the ball.
| Player & Team | Position / Number | Stats | Highlights / Details |
|---|---|---|---|
| Dante Moore, Oregon | Oregon quarterback, No. 5 | 285 passing yards | Moore led the game in passing yardage and connected with Jamari Johnson for a touchdown. |
| Fernando Mendoza, Indiana | Indiana quarterback, No. 15 | 177 passing yards | Mendoza threw touchdown passes to Omar Cooper Jr., Charlie Becker, Elijah Sarratt, and E.J. Williams Jr. |
Moore’s passing total was 108 yards higher than Mendoza’s. However, that advantage did not translate into a closer game. Indiana scored early after an interception, then added points through rushing touchdowns and additional passing scores.
The Oregon Ducks football vs Indiana Hoosiers football match player stats also show why turnovers matter. Indiana’s D’Angelo Ponds returned an interception for a touchdown on Oregon’s opening possession. That gave Indiana an immediate seven points without needing its offense to drive down the field.
A quarterback comparison should therefore consider more than passing yards. Look at completion percentage, touchdowns, interceptions, sacks, and the circumstances in which turnovers happened. A long passing total doesn’t automatically mean a quarterback controlled the game.
Rushing stats: Which team controlled the ground game?

Rushing yards measure how far players advance the ball on designed runs and quarterback carries. Net rushing totals account for lost yardage, including losses recorded on quarterback sacks under standard college football statistics.
Indiana finished with 185 rushing yards, compared with Oregon’s 93. That 92-yard difference gave the Hoosiers another way to move the ball without relying entirely on passes.
| Player | Team | Rushing yards |
| Dierre Hill Jr. | Oregon | 86 |
| Kaelon Black | Indiana | 63 |
| Jay Harris | Oregon | 35 |
| Roman Hemby | Indiana | 53 |
| Fernando Mendoza | Indiana | 28 |
Individual rushing totals from the official game box score.
Hill led the game among the listed primary rushers with 86 yards. Black contributed 63 yards and scored two rushing touchdowns, including a one-yard run in the second quarter and a 23-yard run in the fourth. Hemby added 53 yards for Indiana.
The difference between individual production and team production is worth understanding. Hill’s 86 yards were close to Indiana’s leading rusher’s total, but Indiana received contributions from several runners. Team rushing statistics also reflect lost yardage, which helps explain why individual totals don’t always add up neatly to the final team figure.
For anyone studying the Oregon Ducks football vs Indiana Hoosiers football match player stats, rushing touchdowns deserve special attention. Black’s two scores helped Indiana turn possession near the goal line into points, rather than settling for field goals.
Receiving stats: The leading targets on both teams
Receiving statistics show which players caught passes and how much ground they gained after or during those catches. A reception is a completed catch, while receiving yards measure the distance gained on those plays.
| Player | Team | Receiving yards |
| Jamari Johnson | Oregon | 83 |
| Elijah Sarratt | Indiana | 75 |
| Charlie Becker | Indiana | 48 |
| Jeremiah McClellan | Oregon | 64 |
| Jay Harris | Oregon | 32 |
| Kenyon Sadiq | Oregon | 29 |
Selected individual receiving totals from the official box score.
Johnson was Oregon’s leading receiver with 83 yards. He also caught a 19-yard touchdown pass from Moore in the first quarter. His production gave Oregon an early response after the opening interception return.
Sarratt led Indiana’s receivers with 75 yards and caught two touchdown passes from Mendoza. Becker added 48 yards, including a 36-yard touchdown reception that helped Indiana extend its lead in the second quarter.
These Oregon Ducks vs Indiana Hoosiers passing, rushing, and receiving stats illustrate why a receiving-yardage ranking isn’t the same as a ranking of game impact. Johnson gained more yards than Sarratt, but Sarratt’s touchdowns were valuable scoring plays. To assess a receiver fully, compare catches, yards, touchdowns, and the situation in which each catch occurred.
Defensive performance and turnovers
Defense often decides whether an offense can turn yardage into points. Interceptions, sacks, forced fumbles, and tackles for loss help explain how defenders disrupt the opposing team’s plans.
Indiana’s defense made a decisive contribution in the semifinal. Ponds returned Moore’s opening pass interception 25 yards for a touchdown, and Indiana recovered a fumble deep in Oregon territory during the second quarter. That recovery set up Black’s short rushing touchdown.
Those plays were valuable because they gave Indiana favorable scoring opportunities. The defense didn’t always need to stop Oregon far from the end zone; it could create a turnover and leave the offense with a short field.
The Oregon Ducks football vs Indiana Hoosiers football match player stats should be read alongside these events. A box score can show the number of turnovers, but the play-by-play explains where they happened and how they affected the score.
When reviewing individual defensive statistics, check these categories:
- Interceptions: Passes caught by defenders instead of the intended receiver.
- Sacks: Tackles of the quarterback behind the line of scrimmage while attempting a pass.
- Tackles for loss: Plays in which a defender stops the ball carrier behind the line of scrimmage.
- Forced fumbles and recoveries: Plays in which possession is lost and the opposing team gains the ball.
Don’t assign a defensive player a specific tackle or sack total unless you’ve checked the individual defensive section of the official box score. Team defensive performance and individual defensive statistics aren’t interchangeable.
Team statistics that explain the 56-22 result
Individual player numbers tell part of the story. Team totals reveal how the game unfolded across all four quarters.
| Team statistic | Oregon | Indiana |
| First downs | 20 | 18 |
| Passing yards | 285 | 177 |
| Rushing yards | 93 | 185 |
| Total offensive yards | 378 | 362 |
| Third-down conversions | 8 of 13 | 11 of 14 |
| Fourth-down conversions | 0 of 2 | 0 of 0 |
| Time of possession | 28:47 | 31:13 |
| Penalties | 5 for 43 yards | 5 for 23 yards |
Official team totals for the January 9, 2026, semifinal.
One detail stands out: Oregon recorded 378 total yards, more than Indiana’s 362, despite losing by 34 points. That doesn’t mean Oregon played the better overall game. Yardage measures movement, not the value of every possession or whether a drive ends in a score.
Indiana converted 11 of 14 third downs, while Oregon converted 8 of 13. A third-down conversion means gaining enough yards to keep a possession alive on third down. Indiana’s higher conversion rate helped it sustain drives and keep its offense on the field.
The teams also differed in their use of the running game. Oregon gained most of its yardage through passing, while Indiana combined passing with a stronger rushing total. Indiana’s ability to score after turnovers widened the gap beyond what total yards alone would suggest.
How to read the player box score correctly
If you’re checking Oregon Ducks football vs Indiana Hoosiers football match player stats for a sports article, fantasy research, or game analysis, use a consistent method.
- Confirm the game date. The October 2025 regular-season matchup and January 2026 playoff semifinal had different results and player totals.
- Check passing numbers. Record completions, attempts, yards, touchdowns, and interceptions. Completion percentage is the share of attempted passes that were completed.
- Compare rushing production. Look at attempts, net yards, yards per carry, and rushing touchdowns rather than ranking runners by yards alone.
- Review receiving contributions. Compare receptions, receiving yards, touchdowns, and longest catches.
- Check defensive and special-teams plays. Interception returns, fumble recoveries, and kicking results can change a game’s outcome.
- Verify every number against the official box score. Avoid combining season averages, regular-season results, and postseason statistics in one table without labeling them.
For example, a reader comparing Moore and Mendoza could conclude that Moore led in passing yards. But that single comparison leaves out Indiana’s rushing advantage, the interception-return touchdown, and the final score. The more useful analysis combines individual numbers with the events that shaped the game.
This approach is intended for general college football readers, sports bloggers, and fans who want to understand a box score. It isn’t a substitute for a full play-by-play review when you need every defensive tackle, snap count, or advanced metric.
Frequently asked questions
Who won the Oregon vs Indiana football game in January 2026?
Indiana won 56-22 on January 9, 2026. The Hoosiers scored 35 points in the first half and added 21 more after halftime. The victory sent Indiana through the College Football Playoff semifinal, while Oregon finished the game with 22 points.
Which quarterback threw for the most yards?
Dante Moore led the semifinal with 285 passing yards, compared with Fernando Mendoza’s 177. Passing yards don’t measure every part of quarterback performance, though. For a fair comparison, check completion percentage, touchdowns, interceptions, sacks, and the score when each player took the field.
Who was Oregon’s leading receiver against Indiana?
Jamari Johnson led Oregon with 83 receiving yards in the January semifinal. He also scored on a 19-yard reception. If you’re comparing receivers across different meetings, verify the game date first because the leading receiver and receiving totals can change from one matchup to another.
How many rushing touchdowns did Indiana score?
Indiana scored two rushing touchdowns in the semifinal, both by Kaelon Black. His scores came on a one-yard run in the second quarter and a 23-yard run in the fourth. These plays complemented Indiana’s passing touchdowns and helped build its lead.
Did Oregon gain more total yards than Indiana?
Yes. Oregon recorded 378 total offensive yards, compared with Indiana’s 362. However, Oregon lost 56-22. The result shows why yardage alone isn’t a reliable way to judge performance: turnovers, touchdowns, third-down success, and scoring opportunities all matter.
Where can I find the complete individual player box score?
The University of Oregon Athletics website publishes the official box score, including passing, rushing, receiving, scoring plays, and other game details. Use the January 9, 2026, game page for the semifinal rather than a season statistics page or the October regular-season meeting.
Were the October 2025 and January 2026 games the same matchup?
No. Indiana won the October 11, 2025, regular-season game 30-20, then defeated Oregon 56-22 in the January 9, 2026, playoff semifinal. When comparing player performance, keep each game’s statistics separate so you don’t attribute a player’s numbers from one meeting to the other.
Final guidance
Use the official January 9 box score as your primary reference if you’re publishing the playoff game’s statistics. If your goal is to compare both meetings, create separate tables for October 11, 2025, and January 9, 2026, and verify every figure before publication.
Author: Lucas Josiph
Last updated: October 28, 2026
You May Also Read