
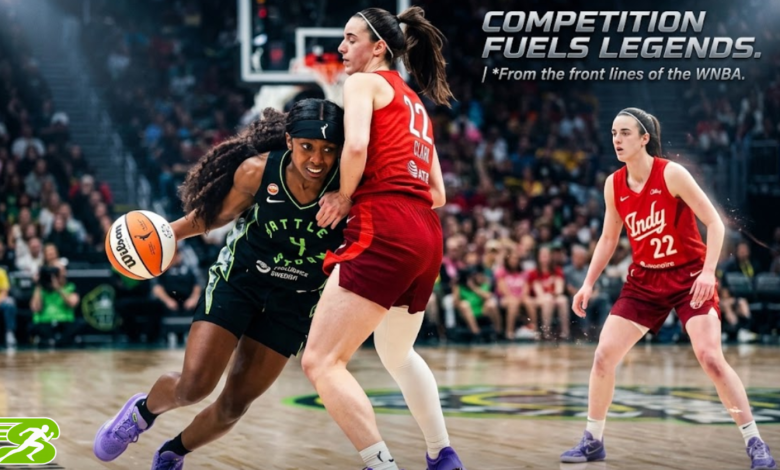
The Indiana Fever defeated the Seattle Storm 89-78 on May 17, 2026, at Gainbridge Fieldhouse in Indianapolis. Caitlin Clark led Indiana with 21 points, 10 assists, and seven rebounds, while Kelsey Mitchell and Sophie Cunningham added 17 points apiece. The official box score and game highlights provide the clearest picture of how Indiana earned the win.
Seattle Storm vs Indiana Fever Match Player Stats: Full Box Score
Indiana built an early lead and held off Seattle’s late push. The Fever scored 32 points in the first quarter, giving them an advantage that proved difficult for the Storm to overcome.
Here is the final team score by quarter.
| Quarter | Seattle Storm | Indiana Fever |
| First | 19 | 32 |
| Second | 25 | 23 |
| Third | 14 | 22 |
| Fourth | 20 | 12 |
| Final score | 78 | 89 |
Indiana won by 11 points. The Fever also scored 50 points in the paint, meaning points scored near the basket, compared with Seattle’s 30. That difference helps explain how Indiana created scoring opportunities even when the Storm tried to recover late in the game.
Indiana Fever player statistics
The following figures come from the official game report.
| Player | Points | Rebounds | Assists |
| Caitlin Clark | 21 | 7 | 10 |
| Kelsey Mitchell | 17 | 0 | 2 |
| Sophie Cunningham | 17 | 3 | 0 |
| Myisha Hines-Allen | 8 | 6 | 4 |
| Makayla Timpson | 6 | 6 | 1 |
| Lexie Hull | 9 | 4 | 2 |
Source: Official May 17, 2026, game book. Rebounds and assists are listed as recorded in the game report.
Clark’s line stands out because she contributed in several areas rather than relying only on scoring. Her 10 assists show how often she created scoring chances for teammates. Mitchell and Cunningham supplied additional offense, giving Indiana multiple players who could put pressure on Seattle’s defense.
Seattle Storm player statistics
Seattle had several useful individual performances, but the team couldn’t match Indiana’s total production.
| Player | Points | Rebounds | Assists |
| Flau’jae Johnson | 14 | 6 | 0 |
| Natisha Hiedeman | 11 | 2 | 3 |
| Stefanie Dolson | 6 | 5 | 2 |
| Jordan Horston | 2 | 2 | 3 |
Source: Official NBA box score. This is a selected-player table, not a complete roster listing.
Flau’jae Johnson’s 14 points made her a notable scorer for Seattle in this matchup. Natisha Hiedeman also contributed 11 points. However, Seattle’s offense struggled to keep pace with Indiana’s first-quarter production, leaving the Storm with too much ground to make up.
How Caitlin Clark Influenced the Game
Clark’s 21 points, 10 assists, and seven rebounds made her the central statistical figure in Indiana’s win. An assist is credited when a pass directly leads to a made basket. It helps show how a player creates scoring opportunities rather than simply finishing them.
Her 10 assists were especially useful because Indiana had several teammates contributing points. Mitchell and Cunningham each scored 17, while Hines-Allen added eight points and six rebounds. That balance made it harder for Seattle to focus its defensive attention on one player.
Clark also collected seven rebounds, helping Indiana finish possessions and begin new attacks. A rebound is recorded when a player gains control of the ball after a missed shot.
For readers checking Seattle Storm vs Indiana Fever match player stats, Clark’s complete line is more informative than her points total alone. It shows her impact as a scorer, passer, and rebounder in the same game.
What the Scoring by Quarter Reveals
The quarter-by-quarter score tells the story of this matchup more clearly than the final margin alone.
Indiana opened with 32 points in the first quarter, compared with Seattle’s 19. The Fever then added another 22 points in the third quarter, while the Storm managed 14. Those stretches helped Indiana maintain control even though Seattle scored more points than Indiana in the second and fourth quarters.
Seattle’s 20-point fourth quarter was a stronger finish, but Indiana had already established a substantial lead. The Fever scored 12 points in the final period, and that was enough to preserve the victory.
The lesson for anyone reviewing a basketball box score is straightforward: look at the timing of scoring runs. Two teams can have competitive stretches while one side still controls the game because it builds a large lead earlier.
In this case, Indiana’s first-quarter advantage was a major part of the result.
Seattle Storm vs Indiana Fever Match Highlights and Player Stats

The official highlights are useful for viewers who want to connect the numbers with what happened on the court.
Official WNBA game highlights, May 17, 2026
Watch Seattle Storm vs Indiana Fever full-game highlights on YouTube
The WNBA’s official highlights cover Indiana’s 89-78 win. The game report also records Seattle’s late attempt to close the gap, including a 9-0 run described in the Storm’s official highlight recap. Indiana’s lead, however, remained too large for Seattle to erase.
When watching the highlights, focus on three things:
- Indiana’s early offense: The 32-point opening quarter established the game’s initial direction.
- Clark’s playmaking: Her 10 assists show the value of passes that create scoring opportunities for teammates.
- Seattle’s fourth-quarter response: The Storm scored 20 points in the final period, but the comeback fell short.
These moments give context to the Seattle Storm vs Indiana Fever match player stats. A box score tells you what each player recorded; video helps you see how those numbers developed.
Indiana Fever vs Seattle Storm Starting Lineup and Player Performance
Starting lineups matter because they show which players began the game, but a starting role doesn’t automatically mean a player had the biggest impact. Bench players can change the game’s pace, add scoring, or help a team respond to a difficult stretch.
For the May 17 matchup, the official game book is the best place to verify the starters, substitutions, minutes played, and individual statistics. Check the official game report PDF before publishing a full starting-five list.
The distinction matters for SEO articles covering player performance. A starting lineup should not be confused with a list of the team’s leading scorers. A reserve who scores efficiently in limited minutes can still have a meaningful role.
Indiana’s balanced scoring in this game is a useful example. Clark led in points and assists, while Mitchell and Cunningham each scored 17. Those numbers show that the result involved contributions from multiple players rather than one scorer carrying the entire offense.
How to Read a Basketball Box Score Correctly
If you’re comparing individual performances, a few basic statistics are enough to get started.
| Statistic | Meaning | Why it matters |
| PTS | Points | Measures scoring output |
| REB | Rebounds | Shows recovery of missed shots |
| AST | Assists | Tracks passes leading directly to baskets |
| FG% | Field-goal percentage | Shows the share of field-goal attempts made |
| 3PM | Three-pointers made | Counts successful shots from beyond the three-point line |
| TO | Turnovers | Counts lost possessions |
| MIN | Minutes played | Gives context to a player’s total production |
A useful comparison looks at production alongside playing time and shooting attempts. A player with 12 points in 15 minutes has a different scoring workload from a player who records 12 points in 35 minutes. Neither line tells the full story without context, but minutes help readers understand the role each player played.
Also distinguish between rebounds and assists. Rebounds come from gaining possession after a missed shot, while assists are credited for passes that lead directly to made baskets.
For Seattle Storm vs Indiana Fever match player stats, use the official box score as the source of record. If another site displays different figures, check whether it covers a different game, includes a later correction, or uses a different statistical category.
Common Mistakes When Comparing Player Stats
The first mistake is mixing statistics from different dates. Teams can meet multiple times in one season, and player availability, starting roles, and scoring totals can change from game to game. Always confirm the date before copying a stat line.
Another mistake is treating points as the only measure of performance. Clark’s 10 assists and seven rebounds, for example, add important context to her 21 points. A player who contributes to ball movement or defense might have value that a points-only comparison misses.
A third mistake is publishing an incomplete lineup as though it were official. If you need all five starters, verify the game book rather than inferring the lineup from the highest-scoring players.
Finally, don’t use a highlight clip as the only source for exact statistics. Video is helpful for reviewing plays, but the official box score is better for checking minutes, shooting percentages, turnovers, and other numerical details.
Who Should Use This Match Report?
This report is for WNBA fans, casual basketball viewers, sports bloggers, and readers who want a quick explanation of the May 17, 2026, game. It provides the final score, selected player statistics, and context for Indiana’s victory.
It isn’t a complete season comparison, a prediction for a future matchup, or a full statistical ranking of every player. For those purposes, use the relevant season statistics or the box score for the specific game you’re researching.
For publishers, the practical approach is to match the article’s date, headline, and statistics to the same official game. That keeps readers from confusing one matchup with another.
Frequently Asked Questions
Who won the Seattle Storm vs Indiana Fever game on May 17, 2026?
The Indiana Fever won 89-78. Indiana established a 13-point lead in the first quarter and maintained the advantage through the second half. The final score and quarter-by-quarter breakdown are available in the official game summary.
How many points did Caitlin Clark score against Seattle?
Caitlin Clark scored 21 points. She also recorded 10 assists and seven rebounds, making her stat line valuable for readers comparing overall contributions rather than scoring alone. Always check the game date when comparing her numbers across different Fever matchups.
Who was Seattle’s leading scorer in this game?
Flau’jae Johnson scored 14 points for Seattle in the May 17 matchup. Natisha Hiedeman added 11. These figures apply to this particular game, not the players’ season averages or their performances in later meetings.
Where can I find the complete official box score?
The NBA’s official game box score and the official game book PDF are reliable starting points. The game book is particularly useful when you need to verify individual minutes, shooting attempts, rebounds, assists, and lineup information.
Do player statistics include overtime?
Yes, official box scores include statistics from overtime when a game goes beyond regulation. The May 17, 2026, matchup ended after four quarters, so its final score of 89-78 did not require an overtime period.
What does plus-minus mean in basketball statistics?
Plus-minus measures the difference between a team’s points scored and points allowed while a particular player is on the court. It provides context about the game’s score during that player’s minutes, but it doesn’t prove that the player alone caused the difference.
Final Advice
Before using Seattle Storm vs Indiana Fever match player stats in a report, confirm the date and cross-check the figures against the official game book. For the May 17, 2026, matchup, start with the official box score and use the WNBA highlights for visual context.
Author: Lucas Josiph
Last updated: October 28, 2026
You May Also Read